Service Level Objectives & Indicators
SLOs (Service Level Objectives) and SLIs (Service Level Indicators) are our best friends when it comes to keeping our services healthy and our users happy. Think of them as the thermometer and the fitness goals for our applications!
📈 Service Level Indicators (SLI)
SLIs are like the vital signs of our system. We mainly monitor latency (response time), service availability, and throughput. Imagine these indicators as your car’s dashboard: they immediately tell you if everything is working as it should.
Latency is measured in milliseconds and is often analyzed using percentiles: the p95 (95th percentile) tells us that 95% of requests are faster than that value. Throughput, measured in requests per second (RPS), tells us how stressed our system is.
🎯 Service Level Objectives (SLO)
SLOs translate our indicators into concrete objectives. A classic example is “99.9% of requests must complete within 200ms.” This brings us to the concept of the “9s” of availability:
| Availability | Annual downtime | Typical use |
|---|---|---|
| 99% (2 9s) | 3.65 days | Non-critical internal services |
| 99.9% (3 9s) | 8.76 hours | Business-critical services |
| 99.99% (4 9s) | 52.6 minutes | Financial services |
| 99.999% (5 9s) | 5.26 minutes | Highly critical systems |
💼 Service Level Agreements (SLA)
SLAs are crucial contractual documents that define our formal commitment to customers. Unlike internal SLOs, SLAs have direct legal and financial implications.
Key Components of an SLA
An effective SLA clearly defines:
- Measurable service metrics (e.g. 99.5% uptime)
- Measurement period (monthly/quarterly/annual)
- Calculation method and monitoring tools
- Escalation process in case of problems
- Penalty schedule
Safety Margins
We always maintain a buffer between internal SLOs and external SLAs:
|
|
Violation Management
In case of an SLA violation, the following is typically triggered:
- Immediate notification to stakeholders
- Post-mortem analysis of the incident
- Calculation of service credits
- Future mitigation plan
Typical Service Credits
| Monthly Availability | Credit |
|---|---|
| < 99.9% | 10% |
| < 99.5% | 25% |
| < 99.0% | 50% |
Best Practices
- Negotiate realistic SLAs based on historical data
- Include planned maintenance periods
- Clearly define exclusions (force majeure)
- Periodically review and update agreements
📊 The Metrics Triangle
Imagine a magic triangle where each corner represents a crucial aspect:
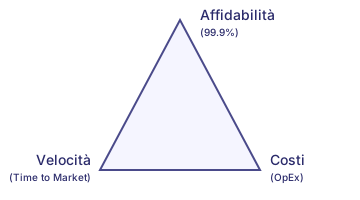
The key is finding the right balance between:
- Service reliability
- Speed of innovation
- Operational costs
💰 Error Budget and Risk Management
The error budget is our margin for maneuvering innovation. If we have a 99.9% SLO, it means we can “spend” 0.1% on downtime. This translates to about 43 minutes per month of acceptable interruptions.
Practical Management
When our error budget is:
🟢 Below 50% utilization: We can accelerate releases and experiment
🟡 Between 50% and 75%: We proceed with caution
🔴 Above 75%: It’s time to slow down and stabilize
The key is balancing speed and stability: better a system that works at 99.9% with useful features than one at 99.999% but static and outdated.
Practical Tips
Always start with realistic goals: it’s better to promise 99.9% and keep it than to aim for five 9s and fail. Remember that each additional “9” costs exponentially more in terms of resources and complexity.
Remember: true success doesn’t lie in perfect numbers, but in the ability to keep users satisfied while balancing reliability and innovation! 🎯